


Building a More Inclusive Economy
Why economic inclusivity benefits the whole community, and where we currently stand

In 2018, researchers with the Boston Consulting Group found that companies with “above-average diversity scores” reported 19% higher revenues from innovation than companies with “below-average diversity scores.”[1] Greater levels of diversity and economic inclusion in the workplace have been shown to contribute to greater levels of innovation, entrepreneurship, and overall economic growth. Our research found this holds true for regions, too.
BRAC recognizes the role diversity and economic inclusion play in fostering a region’s economic vitality, and that’s why BRAC is hosting its inaugural Economic Inclusion Symposium tomorrow, August 18, at the Raising Canes River Center from 9:00 a.m. – 3:30 p.m. (walkup registration is welcome). Formerly known as the Diversity in Business event, this year’s Economic Inclusion Symposium has been revamped into a half-day conference to include a keynote, breakout sessions, and a vendor connection showcase for minority-owned businesses to connect with local contracting opportunities. Thursday’s Economic Inclusion Symposium offers an opportunity for BR By The Numbers to check in on Baton Rouge’s progress in some key diversity- and economic inclusion-related indicators that were used to help formulate BRAC’s 5-year strategic plan.
In 2019, BRAC, in partnership with Ernst & Young, collected data across 48 metrics to help inform BRAC’s new strategic plan. Eight of these metrics were aggregated to measure the Baton Rouge Metro’s “Inclusive” ranking, determined by comparing the Capital Region against 39 peer metros. This “Inclusive” ranking, which included indicators like “educational attainment by race,” “percentage of people working in poverty,” and more, listed Baton Rouge at 39th out of 40, signaling Baton Rouge has some work to do in ensuring economic opportunities for all residents.
Employment growth is one of several economic growth indicators that can be used to demonstrate the importance of fostering an inclusive economy. The graph below, which comes from the 2019 data collection, shows that more inclusive regional economies experience greater employment growth on average than less inclusive regional economies.

For this analysis, we looked at three “inclusive” indicators included in the original analysis with Ernst & Young:
Management occupations (by race and gender)
Household income (by race)
Educational attainment (by race)
While Baton Rouge has a tapestry of residents of several races and ethnicities, the Ernst & Young data showed that the greatest disparities were between the two largest racial groups – Black and white residents – which will be the focus of this piece. To get a general sense of the number of residents in these two groups, a table based on 2020 population numbers is below.

Management Occupations
In general, women and members of minority groups are underrepresented in managerial positions. Despite making up about half the population, women made up just 41% of managers in 2020, up 2% from 2018. Baton Rouge does slightly better than the nation as a whole, which comes in just short of 41%.

Black residents in Baton Rouge face greater underrepresentation in management occupations. Making up 35% of Baton Rouge Metro’s population, Black residents occupy just 18% of managerial positions. Even after adding an estimated 659 Black residents to the managerial ranks between 2018 and 2020, Black residents in our region hold about half of the management occupations one would expect based on population size.

Household Income
Black households in our nation typically have much lower incomes than white households. While this holds true in Baton Rouge, incomes appear to be rising faster for Black households than for white households.
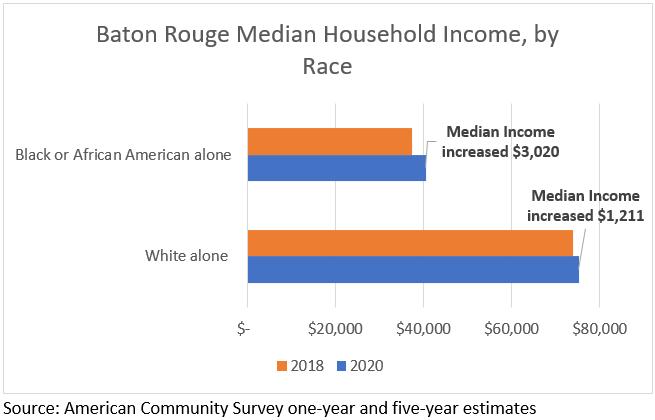
Data from 2020 shows that Black households in Baton Rouge have the second highest income when compared to five peer metros, putting us above regions like Greenville, Little Rock, and Mobile. White households in Baton Rouge also have comparably high incomes, greater than all peer metros in this analysis. Despite these high household incomes, significant inequities exist: white households brought in $1.86 for each $1.00 in Black household income. This creates an interesting dynamic in which Black households in Baton Rouge have among the highest incomes while simultaneously facing high income disparity when compared to Black households in peer metros.

Educational Attainment
Educational attainment, measured as the number of residents age 25+ years with a bachelor’s degree or higher, is also typically lower for Black residents than for white residents. While there have been only marginal shifts in educational attainment rates over the past two years, it’s worth pointing out that the number of Black residents with a bachelor’s degree increased by an estimated 2,400 graduates while the Black population in the Metro age 25+ years fell by a little more than 1,000 residents, meaning per capita educational attainment improved.

Closing thoughts
This week’s Economic Inclusion Symposium represents one of the many steps necessary towards ensuring equal economic opportunity for all residents in Baton Rouge. Parity between white and Black residents in areas like educational attainment, household income, and managerial representation will take time and concerted effort on behalf of business and civic leaders. The data presented here shows that while progress is being made, and progress even at the margins does add up over time, there’s still significant work to be done. BRAC will continue to track and support Baton Rouge’s performance in these three metrics and others over the course of BRAC’s five-year strategic plan.
Methodology Notes
This brief looks at 2018 and 2020 American Community Survey Data. We looked at 2018 one-year estimates and 2020 five-year estimates because 2020 one-year estimates are not available. Comparing one-year versus five-year estimates is not a best practice, so we plan to produce an updated analysis when 2021 one-year estimates are released in September 2022.
[1] https://www.bcg.com/publications/2018/how-diverse-leadership-teams-boost-innovation